
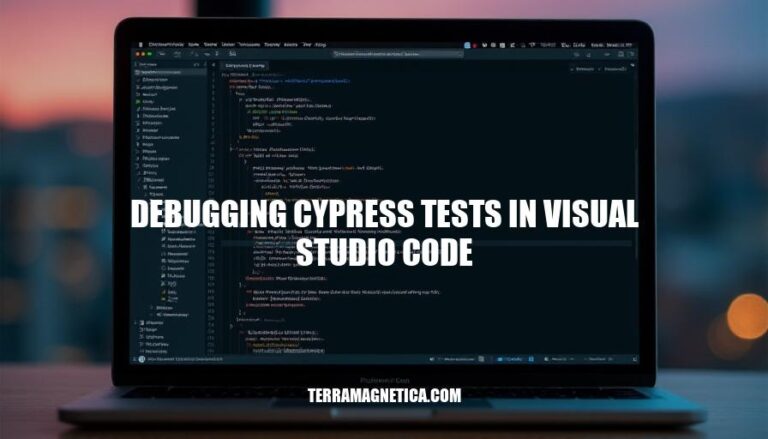
Debugging Cypress tests in Visual Studio Code is crucial for ensuring the reliability and efficiency of your test suite. Visual Studio Code offers powerful debugging tools that allow you to step through your tests, inspect variables, and view call stacks, making it easier to identify and fix issues quickly. This IDE’s integration with Cypress enhances productivity by providing a seamless environment for writing, running, and debugging tests, ultimately leading to more robust and maintainable code.
Here are the steps to set up Cypress in Visual Studio Code:
Install Node.js:
node -v and npm -v in your terminal.Create a New Project:
Initialize npm:
npm init -y to create a package.json file.Install Cypress:
npm install cypress --save-dev.Open Cypress:
npx cypress open to open the Cypress Test Runner.Install VS Code Extensions:
Configure Debugging:
.vscode folder in your project root..vscode, create a launch.json file with the following configuration:{
"version": "0.2.0",
"configurations": [
{
"type": "node",
"request": "launch",
"name": "Cypress Debug",
"program": "${workspaceFolder}/node_modules/cypress/bin/cypress",
"args": ["open"],
"cwd": "${workspaceFolder}",
"console": "integratedTerminal",
"internalConsoleOptions": "neverOpen"
}
]
}
Run and Debug Tests:
This setup will get you started with Cypress in Visual Studio Code, allowing you to write, run, and debug your tests efficiently.
Here’s a detailed guide on writing Cypress tests in Visual Studio Code, emphasizing best practices and tips:
Install Cypress:
npm install cypress --save-dev to install Cypress as a development dependency.Open Cypress:
package.json:"scripts": {
"cypress:open": "cypress open"
}
npm run cypress:open to open the Cypress Test Runner.Create a Test File:
cypress/integration folder, create a new file, e.g., example.spec.js.Write a Basic Test:
describe('My First Test', () => {
  it('Visits the Kitchen Sink', () => {
    cy.visit('https://example.cypress.io')
    cy.contains('type').click()
    cy.url().should('include', '/commands/actions')
  })
})
Organize Tests:
describe blocks to group related tests.Use Data Attributes for Selectors:
data-* attributes:<button data-cy="submit">Submit</button>
cy.get('[data-cy=submit]').click()
Isolate Tests:
Programmatically Handle Authentication:
Use Custom Commands:
cypress/support/commands.js:Cypress.Commands.add('login', (email, password) => {
cy.request('POST', '/login', { email, password })
})
cy.login('[email protected]', 'password')
Assertions and Retry-ability:
cy.get('input').should('be.visible').and('have.value', 'Cypress')
Focus on User Journeys:
Use Fixtures for Test Data:
cypress/fixtures and load it in your tests:cy.fixture('user').then((user) => {
cy.get('input[name=email]').type(user.email)
})
Leverage Cypress Plugins:
cypress-axe for accessibility testing or cypress-real-events for simulating real user interactions.By following these steps and best practices, you’ll create robust and maintainable Cypress tests in Visual Studio Code. Happy testing!
Here’s how to use breakpoints in Visual Studio Code to debug Cypress tests:
debugger statement in your test code or by configuring a launch configuration in VS Code.When the test execution hits a breakpoint, you can inspect variables, view the call stack, and evaluate expressions in the debug console.
Happy debugging!
To inspect variables and values while debugging Cypress tests in Visual Studio Code, you can use several tools and techniques:
Breakpoints: Set breakpoints in your Cypress test file where you want the execution to pause. This allows you to hover over variables to see their current values.
Debug Console: Use the Debug Console to step through your tests. You can execute commands, inspect the state of your application, and identify errors.
Debugger Statement: Insert debugger statements in your test code. When the test execution hits this statement, it will pause, allowing you to inspect variables and the current state.
.then() Function: Use the .then() function to add a debugger at the appropriate time during command execution. This helps in inspecting the objects that Cypress yields.
.debug() Command: Utilize the .debug() command provided by Cypress to pause the test execution and inspect the state of your application.
Console Logs: Add console.log() statements in your test code to print variable values and other information to the console for inspection.
These methods leverage the debugging capabilities of Visual Studio Code and Cypress to provide a comprehensive debugging experience.
Use cy.wait():
cy.get('button').click();
cy.wait(500); // Wait for 500ms
cy.get('.result').should('contain', 'Success');
cy.wait() to introduce delays where necessary to ensure elements are available.Chain Commands:
cy.get('button').click()
  .then(() => {
    cy.get('.result').should('contain', 'Success');
  });
Use cy.wrap():
cy.wrap(Promise.resolve('foo')).then((value) => {
  expect(value).to.equal('foo');
});
cy.wrap() to handle promises and ensure Cypress waits for them to resolve.Leverage debugger Keyword:
cy.get('button').click();
debugger; // Execution will pause here
cy.get('.result').should('contain', 'Success');
debugger in your code to pause execution and inspect variables.Use .then() for Assertions:
cy.get('button').click()
  .then(() => {
    cy.get('.result').should('contain', 'Success');
  });
.then() to perform assertions after asynchronous operations.Visual Studio Code Debugging:
{
  "type": "node",
  "request": "launch",
  "name": "Cypress Tests",
  "program": "${workspaceFolder}/node_modules/.bin/cypress",
  "args": ["open"]
}
By implementing these strategies, you can effectively debug asynchronous tasks in Cypress tests using Visual Studio Code.
Here are some common issues encountered while debugging Cypress tests in Visual Studio Code, along with solutions:
Commands not executing as expected:
cy.visit() and cy.get() enqueue actions, causing debugger statements to execute prematurely..then() to ensure the debugger statement executes after the command completes:cy.visit('/my/page/path')
.get('[data-testid="selector-in-question"]')
.then(($selectedElement) => {
debugger; // Debugger is hit after commands complete
});
Tests failing in CI but passing locally:
cy.intercept() to stub network requests and control test conditions.Browser detection issues:
Slow test execution:
cy.intercept() to stub network requests, and split large tests into smaller, more manageable ones.Configuration errors:
cypress.json.Debugging TypeScript issues:
Debugging Cypress tests in Visual Studio Code offers numerous benefits, including improved efficiency, enhanced collaboration, and better test maintenance. By leveraging VS Code’s features, such as launch configurations, debugging tools, and extensions, developers can streamline their testing process and identify issues more effectively.
To get the most out of debugging Cypress tests in VS Code, it’s essential to configure the environment correctly, use the right tools and plugins, and apply best practices for writing and maintaining tests. This includes setting up a launch configuration, using the debugger, and leveraging features like breakpoints and conditional breakpoints.
When encountering common issues such as commands not executing as expected, tests failing in CI but passing locally, browser detection problems, slow test execution, configuration errors, or debugging TypeScript issues, developers can apply specific solutions to resolve these problems. These may involve adjusting Cypress configurations, optimizing test scripts, using stubbing and mocking techniques, or ensuring proper TypeScript setup.
By mastering the art of debugging Cypress tests in Visual Studio Code, developers can significantly improve their testing workflow, reduce time spent on troubleshooting, and deliver higher-quality software products.